Using Metrics Responsibly
Improving developer productivity is possible. Getting there means challenging and inverting deeply ingrained beliefs about measurement. Standard practices conspire to deprive us of the actual value of using data to guide continuous improvement.
Do any of these situations sound familiar?
- One set of metrics is applied to every team universally. Measurement practices for industrial production are assumed to be equally applicable in managing innovation work.
- Teams are compared based on story points and velocity. What does this reveal about the areas where individuals encounter obstacles? Is the purpose these metrics serve tied to continuous improvement?
- DORA metrics are relied on as a panacea. While valuable, these measures may not be relevant to a team’s unique circumstances or objectives.
- Metrics are employed solely for the benefit of leadership, with teams oblivious to what strategies are in play and why they matter.
- Teams start gaming metrics, leading to unintended effects.
There is a common thread. Leadership defines a consistent, one-size-fits-all metrics strategy, deploys it top-down, and expects performance and productivity to improve.
Two faulty assumptions make this model fail. First is a lack of context: believing all teams face the same problems. Second is the gap between knowledge and behavior: how do people in an organization actually use measurement to evaluate new methods and experiments?
Productivity, Performance, and Outcomes
Productivity and performance are discussed extensively in software development, but the words rarely align with intent. The McKinsey article on measuring developer productivity (2023) conflates and interchanges the two. They are not the same thing.
Developer productivity is a measure of output: how much a team or individual produces within two given points in time. Many issues can constrain output: ineffective practices, code that is difficult to work with, clunky release processes. In an organization at scale, different teams will have different areas of improvement, and some will overlap. Wrong outputs that do not meet customer needs can range from irrelevant to destructive, eroding trust.
Developer performance is a measure of skill in executing tasks defined as part of a role or team. It is largely a measurement of activity, specifically proficiency in executing an activity. While it is impressive to see a highly skilled engineer committing and pushing to a repo frequently, this activity becomes irrelevant if it fails to solve a problem.
The authors of Accelerate get to the heart of the matter:
There have been many attempts to measure the performance of software teams. Most of these measurements focus on productivity. In general, they suffer from two drawbacks. First, they focus on outputs rather than outcomes. Second, they focus on individual or local measures rather than team or global ones. (Forsgren et al., 2018, Chapter 2)
While acknowledging the significance of performance and productivity, we advocate prioritizing another dimension: outcome. An outcome is a result that will happen, or someone wants to influence happening. Outcomes deserve greater focus because they link conversations about productivity and performance to intended impacts, answering the question, “So what?” Starting with outcomes helps us understand which parts of productivity and performance require attention and investment.
We express outcomes as facts. We use this format to qualitatively gather perceptions of where a group stands on any given outcome. Typical outcomes, framed as conditions, in software development include:
- We deliver value regularly and rapidly.
- Our tools help us quickly pinpoint the cause of production incidents.
- I am supported in my role and have the time to learn and practice new skills.
- We understand the purpose of the work we do.
- I have ample time to do deep work.
- When tests fail, they provide a clear signal to identifying and resolving underlying issues.
From here we can specify whether skill gaps (performance), practices and tools (productivity), or both need focus to increase the likelihood of an outcome. First, we discover and validate our hunches. Then, we agree on the desired outcome we wish to change. Only then do we work backward to find the relevant, contextual metrics that indicate progress. In other words, we shift from metrics-first to outcome-first.
Discovering and Validating Target Outcomes
Target outcomes often begin as a hunch, a recognition of a problem. Gut feeling and depth of experience play a role in this approach. How might we validate these theories more rigorously? Take a page from the product manager’s playbook.
Product discovery involves going into the outside world, asking questions, gathering data, and sifting through insights to inform better choices and increase the odds of bets, typically before getting into expensive software delivery. These techniques include qualitative (interviews, surveys) and quantitative (data analysis, A/B tests) methods.
Starting with a hunch, discovery leads down a few possible paths:
- No one wants our idea. Fail fast and move on to the next most promising idea.
- We pivoted our idea into a better and more specific plan through learning.
- Discovery confirms our idea as good. Invest by building something to increase the fidelity of our idea testing.
We can apply these techniques to develop outcomes across product engineering: product, business, process, and technical outcomes. We help our clients discover outcomes across three broad categories: developer experience, flow of value, and product impact. The specific methods and data sources change depending on the type of outcome, but the workflow is identical.
We do not dive into metrics head first. We begin by considering what we want to achieve or influence. We test this by asking teammates or customers, building consensus, reasoning with data, and focusing on small, achievable outcomes that yield a path toward larger ones.
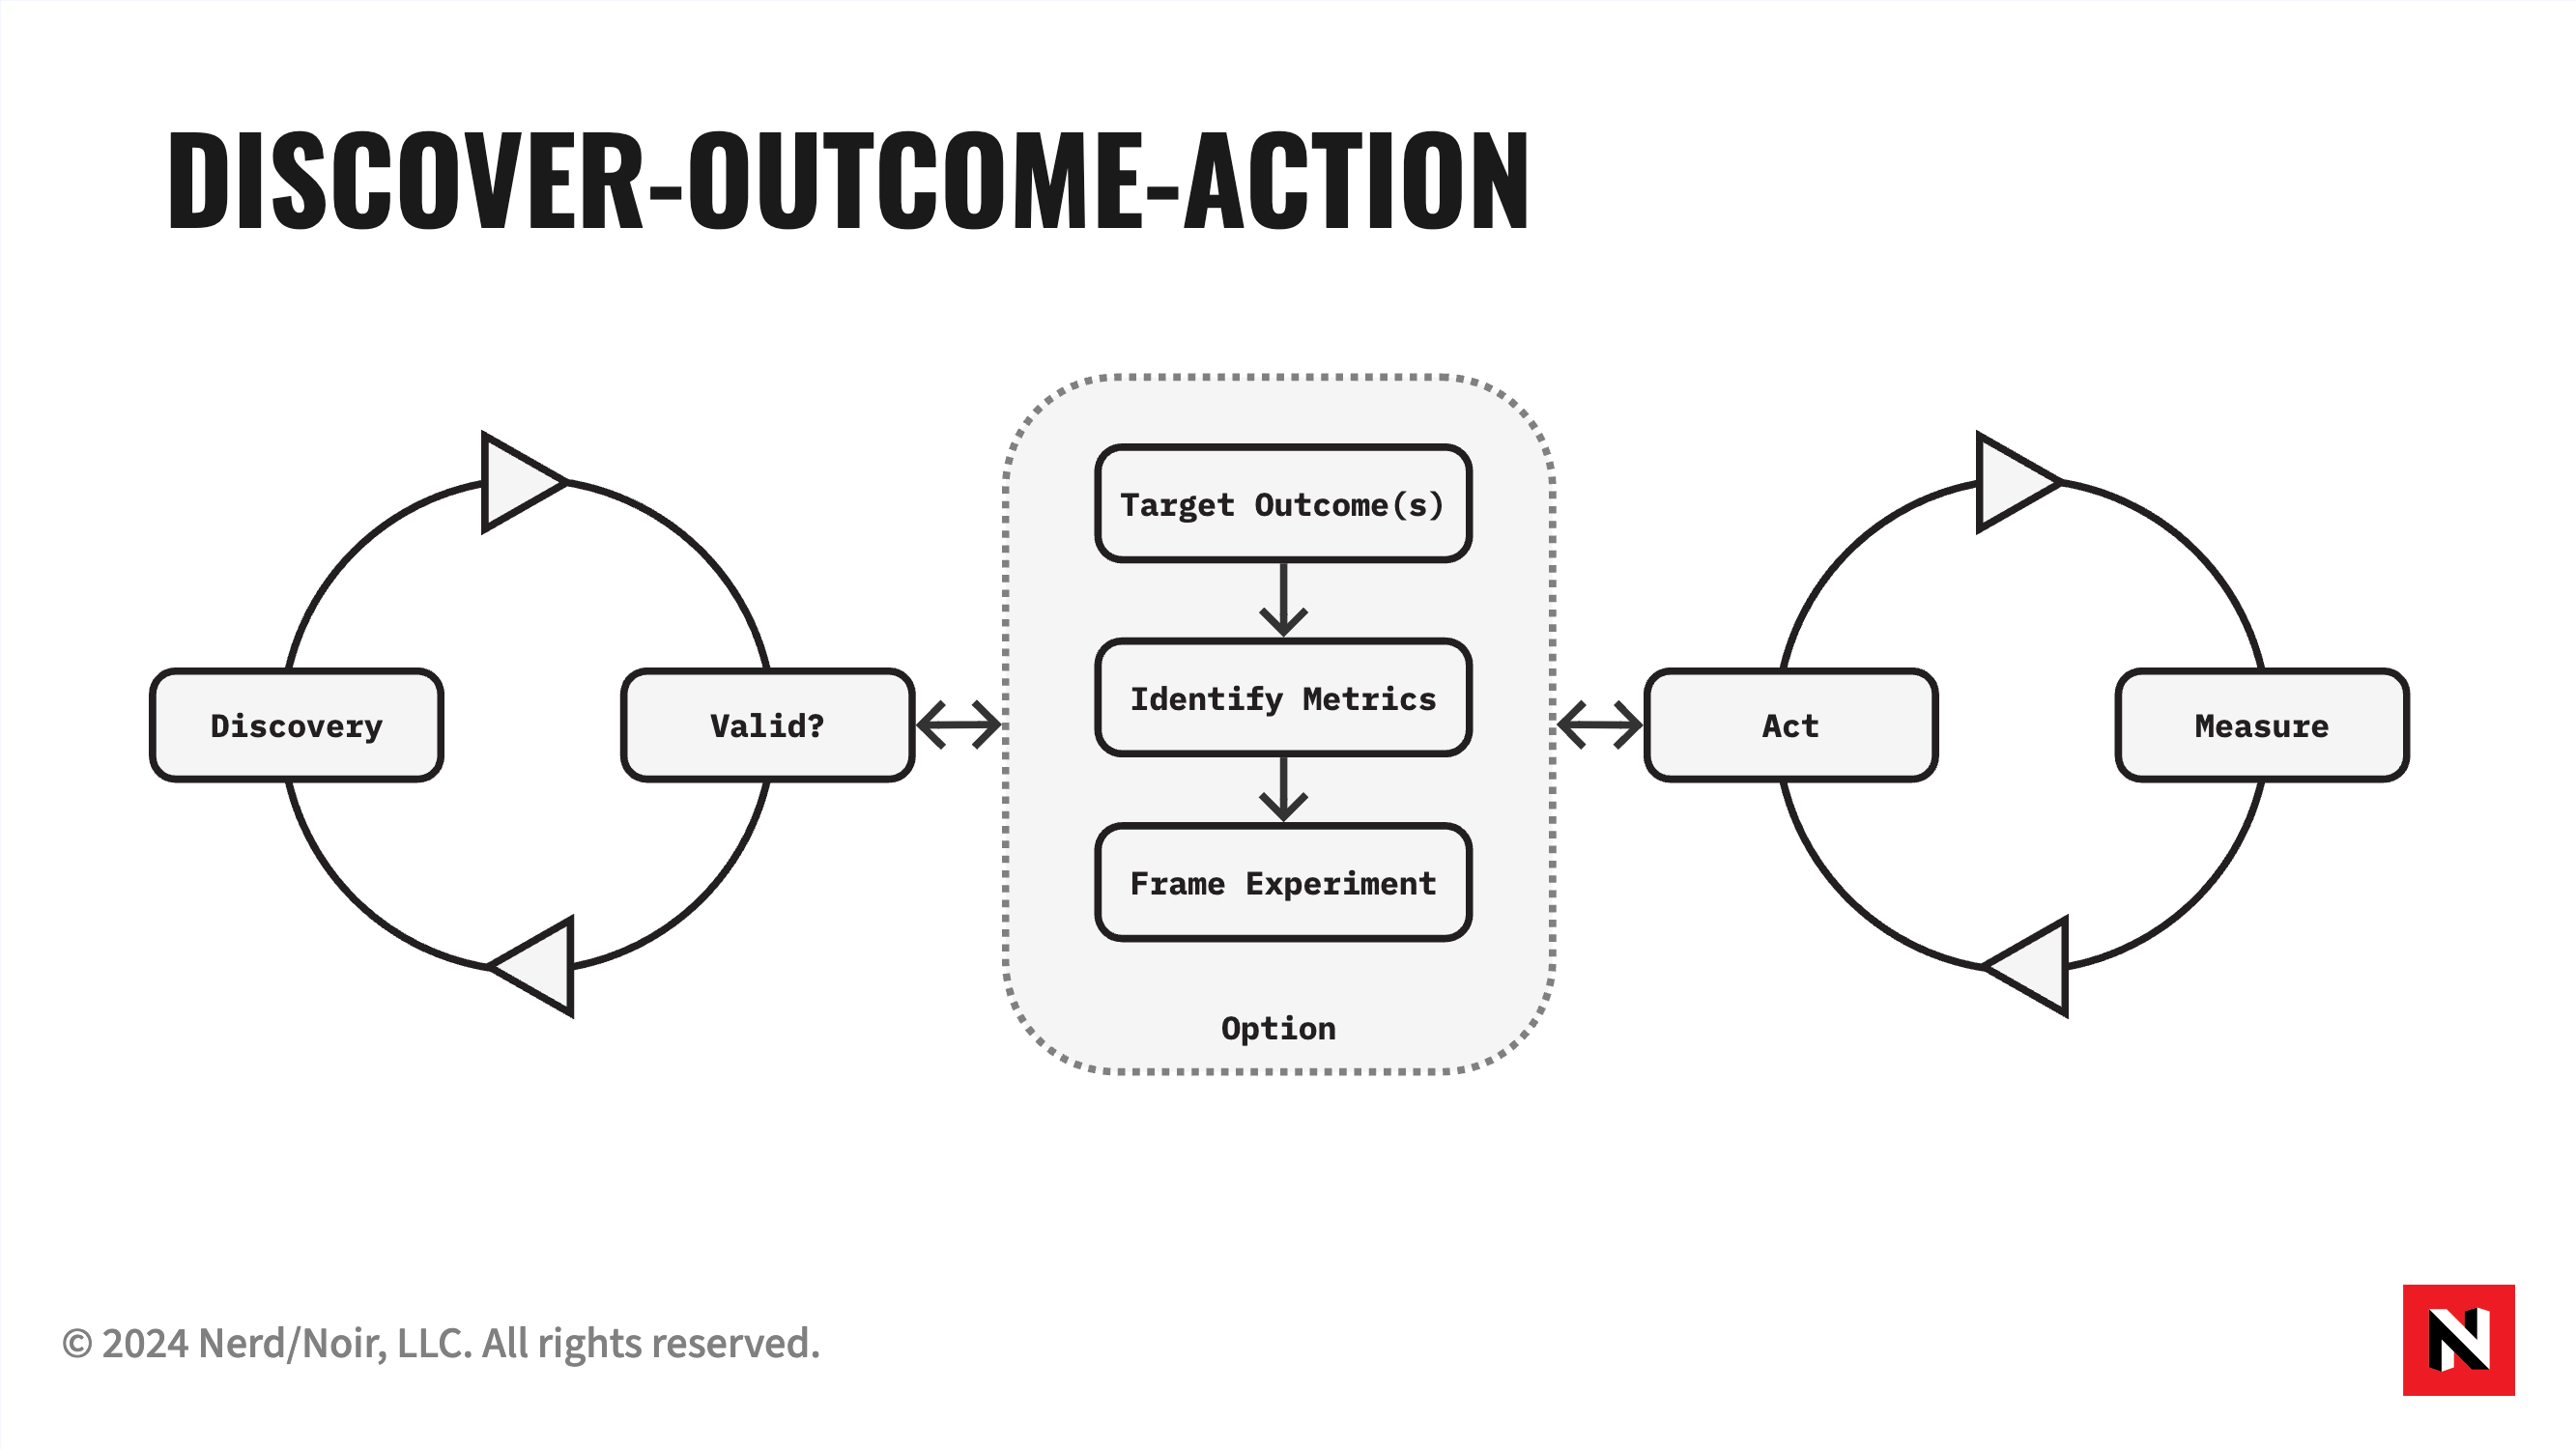
Only when we have identified outcomes to target do we work backward to identify relevant metrics to help measure progress. This is the Discover-Option-Action Cycle: Discovery validates a hunch, a decision gate determines whether the hunch holds, and if it does we target an outcome, identify metrics, act, and measure. If the hunch doesn’t hold, we frame an experiment and loop back. As with product discovery, finding worthwhile outcomes is an ongoing process of validating and adjusting as we gather more data, insights, and confidence. Both outcomes and accompanying metrics benefit from refinement and iteration.
Example: Discovering and Targeting an Outcome
A new engineering manager suspects her team could improve the flow of their value. She jots down a productivity-oriented outcome: “our delivery of value is constant, steady, and predictable.” Time to put her idea to the test with some detective work.
She turns to her project tracking software and begins sifting through data. She notices that her team, who uses a lightweight, agile-inspired workflow, regularly carries stories across 2-3 iterations. Her observations during the team’s bi-weekly review confirm the data. She also finds a wide variance in story size, with the team trending toward larger stories that roll over into the following sprints. Using her company’s DevEx 360 instance, she notices her team is picking up on this trend with low satisfaction scores on requirements quality and batch size, both indicators of releasing early and often.
She scopes her original outcome to something more concrete and immediate: “we work on small stories to ensure a consistent pace of delivery.” She brings this to her team, tells the story with good evidence, and seeks buy-in on commitment. The team agrees to focus on this outcome for the following few iterations, using a few metrics to assess progress: decreased average story size and increased iteration completion percentage.
There is a profound shift here from leader- to team-driven usage of metrics. These conversations originate within a team, not from top-down leadership, strategy function, or a steering committee. The engineering manager proposed an outcome and metrics, but anyone could make such proposals in a healthy team. When she achieved consensus, they set a target outcome. The team itself is driving change from the inside.
Stepping Toward an Outcome-first Culture
Adopting a few key strategies for effective measurement and continuous improvement will significantly impact any organization. Companies can foster a culture of growth and innovation by focusing on outcomes, empowering teams, prioritizing transparency, and emphasizing active listening.
If what we describe sounds like Objectives and Key Results (OKRs), you are partially correct. Classic OKRs focus on goals that cascade top-down. We are arguing for an outcome-first, team-empowerment approach to metrics. We use improving an OKR practice as a vector for exploring these ideas with our clients.
As Outcomes Change, Metrics Will Follow
What happens when an outcome is attained? It may be time to look for a new target outcome, and accompanying metrics may change. Metrics help us answer essential questions. Once those questions get answered, we may no longer need the metric. If the question ever returns, we might pull the metric back into focus. Different teams pursuing different outcomes will naturally select the appropriate metrics.
Garbage In, Garbage Out
Measurement tools that integrate deeply with project trackers or version control systems appeal to our bias toward quantitative measurement. The problem is that effective interpretation depends heavily on context and data hygiene. Asking people about their perceptions is an effective and accurate way to gain insight into the inner workings of any organization.
The original DORA metrics (Forsgren et al., 2014) are helpful and popular but depend on effective tool usage. Sampling the perception of engineers is a quick and accurate way to build a reliable dataset to jumpstart improvement experiments.
Part of our work with organizations is finding the appropriate data sources that guide improvement and educating teams on their practical use. A typical visualization we reach for is a Cumulative Flow diagram, which shows how work proceeds through a system and helps us find potential bottlenecks. The real trick to making this data valuable is incorporating it into habits, meetings, and improvement decisions.
Want to find out how people are doing? Ask them. Perception counts for a lot. There is a fantasy that quantitative is always better and that the right tools will reveal all. To the quants who share this belief, remember that the acclaimed DORA reports gathered their initial data through a survey.
Empowerment Over Mandate
Teams using data to drive their productivity and performance is what real empowerment and ownership look like. Real empowerment fosters a positive work culture that benefits customers.
Given the opportunity and resources to improve, our experience routinely proves that teams will take agency in innovating and solving problems across process, product, and technical domains. As a leader, actively listening to teams is imperative because they are the closest to the friction holding them back.
Align and Balance Top-down and Bottom-up Outcomes
Outcomes can be set by the entire organization or individual teams. They may be presented as a change vision, aligning everyone to a new business goal. On the other hand, teams often set outcomes related to product changes, process improvements, or technical endeavors. It is usual for teams to pursue multiple outcomes simultaneously.
The goal is to foster autonomy in teams in aligning or creating outcomes, whether team-specific or set by senior leadership. Local team outcomes support broader goals set by leaders. Instead of following top-down directives, teams use local outcomes to contribute to the bigger picture, understanding their work’s larger purpose. For instance, if leadership wants faster product launches, a development team might aim to “deliver value more often,” tracking progress with the DORA deployment frequency measure.
We are strongly biased toward teams aligning their outcomes up rather than cascading and assigning outcomes top-down. As Dale Carnegie said, “People will support a world they help to create.”
Transparency, Not Comparison
One of the ways metrics get abused is when they become a target. Goodhart’s Law states, “When a measure becomes a target, it ceases to be a good measure.” When leaders roll out a suite of core metrics to compare or judge the performance of individuals or teams, bad things can and often do happen.
What one can expect is gamification. The “Cobra Effect” explains this best: during British colonial rule in India, a reward was offered for every dead cobra to reduce their numbers. People began breeding cobras for the bounty. When the scheme was discovered and the program was discontinued, the breeders released the now-worthless cobras, causing a surge in the cobra population. Life, uh, finds a way.
A better counterstrategy for leadership is to foment a culture of transparency. By publicizing metrics and focus areas, we avoid creating a privileged class of leaders who use data for mysterious and sometimes scary purposes. Furthermore, we invite discussion and understanding of why one team’s circumstances may necessarily differ from another’s. Let the systems thinking begin.
Bringing It Together
Once a group establishes the Discover-Option-Action Cycle, they can look for tools to accelerate their speed of discovery and make progress visible. The workflow helps teams pursue a balance of simultaneous outcomes: aligning to desired business impacts, delighting customers with products, improving the developer experience, and optimizing the flow of value.
The SPACE Framework (Forsgren et al., 2021) complements this approach by acknowledging that no single metric can explain developer productivity. It encourages teams and leaders to curate metrics across dimensions: satisfaction and well-being, performance, activity, communication and collaboration, and efficiency. What results is a system of measurement that encourages holistic thinking, curiosity, experimentation, and a sense of ownership.
Resources
- Discover-Option-Action Cycle — the core model for outcome-first measurement
- Outcomes Over Outputs — the broader philosophy behind outcome-first thinking
- Output-Activity Trap — what happens when organizations optimize output metrics
- DORA Metrics — outcome-oriented delivery metrics
- Goodhart’s Law — why metric mandates backfire
- Leading and Lagging Indicators — choosing metrics that predict vs. confirm progress
References
- Nicole Forsgren, Jez Humble, and Gene Kim, “Accelerate: The Science of Lean Software and DevOps: Building and Scaling High Performing Technology Organizations” (IT Revolution Press, 2018)
- Forsgren, N., Storey, M.-A., Maddila, C., Zimmermann, T., Houck, B., & Butler, J. (2021). “The SPACE of Developer Productivity” ACM Queue.
- McKinsey & Company. (2023). Yes, You Can Measure Software Developer Productivity. McKinsey.